Java heap analysis – Out of Memory!!!

Skip to end of metadata

Go to start of metadata

Any software developer who has worked with java based enterprise class backend applications would have run into this infamous or awkward error from a customer reporting one or Q.A engineers filing an issue: java.lang.OutOfMemoryError: Java heap space. To understand this, we have to go back to computer science fundamentals of complexity of algorithms specifically “space” complexity. If we recollect, every application has a worst case performance. Specifically, in the memory dimension, when this is unpredictable or is spiky more than the recommended memory allocated to the application, it leads to an over-usage of the heap memory allocated and hence a “out of memory” condition. The worst part of this specific condition is that the application cannot recover and will crash. And, any attempts to restart of the application even with more max memory(-Xmx option) allocation given is not a long term solution. Without understand what caused the heap usage inflation or  spike, memory usage stability hence application stability is not guaranteed. So, what is the more methodical approach for understanding the programming problem related to the memory problem? This is answered by understanding the memory heap of the applications and its distribution when the out of memory happens. With this prelude we will shoot to focus the following:

  • Getting a heap dump from a java process when it goes of of memory.
  • Understanding the type of Memory issue the application is suffering from.
  • Analyzing out of memory issues with a heap analyzer specifically with this great open source project –  Eclipse MAT (https://eclipse.org/mat/).

Setting up the application ready for Heap analysis to generate a heap dump

  • Any non-deterministic or sporadic problems like an out of memory would be a challenge to do any post-mortem. So, the best way to handle OOMs is to let the JVM dump a heap file of the state of memory of the JVM when it went out of memory.
  • Sun HotSpot JVM has a way to instruct the JVM to dump its heap state when the JVM runs out of memory into a file. This standard format is .hprof. So, to enable this feature add -XX:+HeapDumpOnOutOfMemoryError to the JVM startup options. Adding this option is essential to production systems since out of memory could take a long time to happen. This flag adds little or no performance overhead to the application.
  • If the heap dump .hprof file has to be written to a specific file system location, then add the directory path to XX:HeapDumpPath. Just make sure the application has write permissions for the particular directory path given here.

Cause Analysis

  • 101 – know the nature of the out of memory

The most preliminary thing to understand when trying to assess and understand an out of memory error is to come to understand the memory growth characteristics. And, conclude about the following possibilities:

  • Spikes in usage: This type of out of memory could be drastic based on the type of load. An application can be performing well under allocated memory to the JVM for 20 users. When there was a spike to the 100th user, it might have hit a memory spike which lead to the out of memory error. There are two possibilities to tackle this cause.
  • Leaks : This type is one when the the memory usage increases over time which is a problem due to a programming issue.
  • Screen Shot 2015-10-06 at 1.50.21 PM

A leak chart which increases over time after a while of healthy GC collection pattern collection. Note the healthy sawtooth pattern at the  start.

.      Screen Shot 2015-10-06 at 1.52.18 PM

A healthy graph with healthy GC

Screen Shot 2015-10-06 at 1.52.09 PM

          Memory graph with a spike  memory leak.

After we got to the point of understanding what is the nature of the memory issue that caused the usage to surge, the following methodology might be made to avoid hitting the OOM error based on what inference comes out of the heap analysis :

  1. Heap Analysis 
    1. We will be exploring in detail below how to analyze a heap dump using a heap analysis tool. In our case, we will be using the
  2. Fixing a memory issue
    1. Fix the OOM causing code
      1. A leaking object reference – Since an object was added incrementally without clearing their reference (from the object reference of the running application) over a period of time by the application, the programming error has to be fixed. For instance, this could be a hash table which was inserted with business objects incrementally without deleting them after the business logic and transaction was completed.
    2. Increase the maximum memory as a fix –  After understanding the runtime memory characteristics and the heap, the maximum heap memory allocated might have to be increased to avoid OOM errors again since the suggested maximum memory was not enough for the application stability. So, the application might have to be updated to run with a Java flag -Xmx with a higher value based on  the assessment made from the heap analysis.

Heap Analysis using MAT

Now, we get to deep dive into the area of heap analysis which is the main focus of this article. We will go through a sequence of steps which will help explore the different features and views of MAT to get to an example of OOM heap dump and think through the analysis.

  1. Open the heap (.hprof) generated when the out of memory happened. Make sure to copy the dump file to a dedicated folder since MAT creates lots of index files.
    1. File -> open
  2. This opens the dump with options for Leak Suspect Reports and Component Report. Choose to run the Leak Suspect report.  When the leak suspect chart open, the pie in the overview pane shows the distribution of retained memory on a per-object basis. It shows the biggest objects in memory (objects that have high Retained memory – memory accumulated by it and the objects that it references)

Screen Shot 2015-10-06 at 1.59.38 PM

The pie chart above shows 3 problem suspects by aggregating objects which hold the highest aggregated memory references (including shallow and retained).

Let us look at one at a time and assess:

Suspect 1 

454,570 instances of “java.lang.ref.Finalizer”, loaded by “<system class loader>” occupy 790,205,576 (47.96%) bytes. 

The above tells us that there were 454,570 instances of JVM finalizer instances occupying almost 50% of the allocated application memory.  Oops!  What this leads us to understand based on the basic assumption that the reader knows what Java Finalizers do. Read here : http://stackoverflow.com/questions/2860121/why-do-finalizers-have-a-severe-performance-penalty

Essentially, there are custom finalizers written by the developer to release certain resources held by an instance. These instances that are collected by the finalizers are collected outside the scope of the JVM GC collection algorithms using a separate queue. Essentially, this is a longer path to cleaning up by the GC. So, now we are at a point where we are trying to understand what is getting finalized by these finalizers ?

Potentially, Suspect2 which is sun.security.ssl.SSLSocketImpl which is occupying 20% of the memory. Can we confirm if these are the instances held to be cleared by the finalizers  ?

3. Now, let us open the dominator view which is under the tool button on the top of MAT.

Screen Shot 2015-10-06 at 1.55.58 PM

we see all the instances by class name listed parsed by MAT available on the heap dump.

4. Next, on the Dominator view, we will try to understand the relationship between java.lang.Finalizer and sun.security.ssl.SSLSocketImpl. We right click on the sun.security.ssl.SSLSocketImpl row and open Path to Gc Roots -> exclude soft/weak references.

Screen Shot 2015-10-06 at 1.56.04 PM

Now, MAT will start calculating the memory graph to show the paths to GC root where this instance is referenced. This will show up with another page showing the references as below:

Screen Shot 2015-10-06 at 1.56.10 PM

As the above reference chain shows, the instance SSLSocketImpl is held by a reference from java.lang.ref.Finalizer which is about 88k of retained heap by itself at its level. And, we could also notice that the finalizer chain is a linkedlist datastructure with next pointers.

INFERENCE: At this point, we have a clear hint the Java finalizer is trying to collect SSLSocketImpl objects. For the explanation of why so many of them are not collected, we goto code.

5. Inspect code 

Code inspection is needed at this point to see if sockets/ I/O stream are closed in finally clauses. In this case, it revealed that all streams related to I/O were in fact correctly closed.  At this point, we doubt the JVM being the culprit. And, in fact it was the case, there was a bug in Open JDK 6.0.XX where the GC collection code had a bug.

I hope this article gives a model to analyze heap dumps and infer root causes in Java applications. And, there seems to be some light in the tunnel. Happy heap analysis>!!

Recommended Reading:

MAT documentation: http://help.eclipse.org/juno/index.jsp?topic=%2Forg.eclipse.mat.ui.help%2Ftasks%2Frunningleaksuspectreport.html


Shallow vs. Retained Heap


Shallow heap is the memory consumed by one object. An object needs 32 or 64 bits (depending on the OS architecture) per reference, 4 bytes per Integer, 8 bytes per Long, etc. Depending on the heap dump format the size may be adjusted (e.g. aligned to 8, etc…) to model better the real consumption of the VM.

Retained set of X is the set of objects which would be removed by GC when X is garbage collected.

Retained heap of X is the sum of shallow sizes of all objects in the retained set of X, i.e. memory kept alive by X.

Generally speaking, shallow heap of an object is its size in the heap and retained size of the same object is the amount of heap memory that will be freed when the object is garbage collected.

The retained set for a leading set of objects, such as all objects of a particular class or all objects of all classes loaded by a particular class loader or simply a bunch of arbitrary objects, is the set of objects that is released if all objects of that leading set become unaccessible. The retained set includes these objects as well as all other objects only accessible through these objects. The retained size is the total heap size of all objects contained in the retained set.
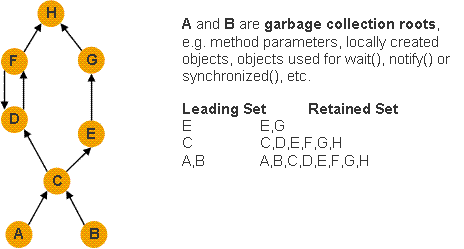
Example object graph

Concurrent Http Load tester with streaming

A couple years ago(almost there!! ), I joined Mashery, a leader in API management(think mobile apps like Starbuck making calls to buy coffee on a daily basis!) which is an Intel company. One of the first cool things I got to do when I joined Mashery is to work on their traffic management cloud hosted SaaS layer which handles about a billion calls per day now. On a layer like this, every hashmap.put and get matters as it affects the JVM’s worst case behavior. I got to investigate some intricate and complex treading as well as caching related stability and performance issues which affected  the  throughout of the traffic coming into the layer. As part of the investigation, I had the do the same sequence of things I do when running into a performance issue:

1. Drive a load which closely as I understand simulated the production characteristics when the server layer starts to tip over into unknown lands. This to me stands as the toughest past since observation and intuition matter the most in my experience.

2. Profile the JVM or look at metrics/logs to understand what is happening to the server(in Mashery’s case a HTTP protocol proxy server or traffic routing layer) beast.

For  driving the load, I had to have corner cases which are not available in most famous load test tools like the JMeter for instance, output streaming of POST data or input streaming to GET HTTP requests. Hence, became this ad hoc developed concurrent http tool.

Introducing ZenShiner : https://github.com/formanojhr/zenshiner

This project’s objective is to contain tools that could stress test any HttpServer with ConcurrentHttpRequests in a non blocking* way and responses are captured and also test corner cases for a http server like response/ request streaming.

Why I wrote this tool ? This project’s objective is to contain tools that could stress test any HttpServer with ConcurrentHttpRequests in a non blocking way and responses are captured as they come back to understand characteristics of a Http Server.

The HTTP server application that I was working on was seeing lots of symptoms of I/O errors which looked like after-effect symptoms of timeouts on request response interruptions on the threads on which the request response cycle was carried on. This was specifically happening for target backends which were exhibiting certain slow latencies from the target backend routed by the HttpServer . 1. Concurrent Http Request: To simulate this, I had a bunch of patterns of concurrent requests simulated through the tool’s command line. So, I added different options for patterns of requests: 2. number of concurrent requests targeted towards a URI batches of number of concurrent requests which can shoot concurrent requests with timed waits between the batches. concurrent requests testing over a fixed duration of time 3. Slow Input/Output streaming: Next, I extended the tool to support input and output request/response streaming which simulates slowness based on command line parameters. 4. Command line: All of these options are configurable with command like parameters.

Caution: This tool is yet to be non-blocking in some ways. The threading model is as below: 1. Each request is created and called in a separate thread pool. 2. The request calls are created as a future and called by exectutor pool. 3. The threads in the pool as and when they become available make the http calls through ApacheHttpClient library as a syncronous call. Since the threads making the calls to the http server are blocking until response comes back with a timeout based on the Apache Http client library, a slow HttpServer can make tool less concurrent.

Micro-benches and Performance

What is Micro-benching?
Recently, I saw a thread dump from a Prod issue where a bunch of threads were on a specific code path doing a lookup up on a java concurrenthashmap. Not sure whether it was a potential performance issue with concurrenthashmap itself. Though this might not be the only issue, I found out that the algorithm used was not the right way to do a cache population with ConcurrentHashmaps for highest concurrency. So I had a new algorithm which is supposedly claimed more concurrent from credible authoritarian sources. But these were the following questions:
– How am I going to prove myself that the new algorithm is going to be better at the modular level (cache)? – How am I going to isolate environment specific factors(free memory available, processor speed, paging thrashes etc) like where the application really runs compared to my laptop still giving me a comparative picture between the two approaches? – How is it that this methodology that I use would take into consideration JVM specifics like for HotSpot JIT compilation, code optimization etc. – How to write these tests which are portable across different environments (dev laptop and Prod staging for instance) ? So the answer I ran into was micro-bench tests. A computer science topic not taught much in academia(at least in my grad school days) but has potential software design decision making implications.

http://en.wikipedia.org/wiki/Java_performance

https://code.google.com/p/caliper/wiki/JavaMicrobenchmarks

Why you would write micro-benches
http://www.ibm.com/developerworks/java/library/j-jtp12214/
Caliper(an open source Java micro-benching framework)
Introductory video: https://code.google.com/p/caliper/
Running caliper benchmark tests
Compiling:
cd
mvn compile
Running the microbenchmark tests
From the Microbenchmark tests directory run : mvn
exec:java -Dexec.mainClass=”com.google.caliper.runner.CaliperMain” -Dexec.args=”com.mashery.proxy.cache.performance.tests.CacheBenchmark”
or mvn exec:java -Dexec.mainClass=”com.google.caliper.runner.CaliperMain” -Dexec.args=
The report of the tests(for the concurrenthashmap) gets uploaded online. Here is an example of two different concurrent hashmap lookup algorithms:
https://microbenchmarks.appspot.com/runs/29496f1d-01e8-4ebf-8519-d48ba3dbe2d7#r:scenario.benchmarkSpec.methodName

Performance profiling of JVMs- coolest part of my job!

This page is a scribe of all things I know and do related to Java performance profiling.

What is profiling?
If you have worked with any sort of JVM runtime, you have probably familiar with one or more of the following:
Java application is not responding or is slower after the last code drop.
is working but goes into a out of memory after a few hours/days/ or on a random spikiness. And you are not sure at what time in the night.
Is working great but goes slowly into an out of memory. You are not sure which new code or hashmap holding a few references is the culprit.
Every resource seems abundant but your application still seems stalling or dragging or stuck in corner case code paths. But you have no visibility if this is a thread starvation issue or not.
There are probably a few queries which you think could be slow that make the application look really slow performing for most of its code paths.
Or you just want to understand the performance characteristics of your application so that you give a documentation on the limits on your application.
Profilers are a parallel to x-ray machines to the human body health check!
So, Java profilers are great tools that can help you get more insight or accurate measurement! So you think performance then it comes down to accurate measurements and observations. You could use the application logging for this if the application had done some good performance logging. Still that might not give what is the accurate visual representation of the application health is like or might not give enough data on the application performance.

How do Java profilers work?
Profilers work by adding runtime instrumentation of counters and run aggregation stats on the top of them. So, be aware of the level of instrumentation could in itself add performance overhead. For instance adding a CPU method level tracing for CPU utilization(available on Yourkit UI) adds more overhead than just running thread tracing alone.
Yourkit
Scribe of yourkit installation instructions:
JDK requirements:
Make sure the JAVAHOME points to a JDK installation(not a JRE). So if see an error as below it means that the JAVAHOME is not a jdk :
[root@localhost bin]# bash yjp.sh Picked up JAVATOOLOPTIONS:
Cannot start the profiler UI: display is not available on this machine.
Yourkit agent library needs a tools.jar in the JDK path which is not available in the JRE installations.). My JAVAHOME points to a 1.6 JDK which is 64bit. Also, just to avoid unnecessary jdk differences, try to keep the versions of the JVM’s version being monitored and the JDK used for yourkit in the same version.
So, my JDK home echo looks like :
[root@localhost lib]# echo $JAVAHOME /usr/java/jdk1.6.0_38 Yourkit install instructions for JVM in a remote Unix based machine:
Download yourkit libraries from online. -http://www.yourkit.com/download/
Download the library for linux platform –
Download the mac version of the UI application (whose link looks like this at the point of writing this wiki: http://www.yourkit.com/download/yjp-2013-build-13050-mac-java7.zip)
The downloaded zip will contain the agent libraries: under /downloads
Mac OS X (Intel) /yjp-2013-build-13050-mac-java7.zip section . Unzip the .zip and there should be a yourkit.app package which can be run as a mac application.

Linux (x86, x64, ARM, ppc, ppc64) section
for instance my build zip looks like this – yjp-2013-build-13050-linux.tar.bz2

Scp the bunzip jar to a relevant ec2/remote machine
using scp option- scp /Users/../Downloads/yjp-2013-build-13050-linux.tar.bz2 :/tmp
Create a directory under (for e.g. etc/yourkit )or something similar to copy over the yourkit library for unzipping.
cp the yjp-2013-build-13050-linux.tar.bz2 file to the etc/yourkit directory
and then run bunzip2 command. e.g. sudo bunzip2 yjp-2013-build-13050-linux.tar.bz2 Then run sudo tar -xvf yjp-2013-build-13050-linux.tar to untar the tar file with sudo permission on the dir.
Starting JVM with yourkit startup options: (For more startup options look at http://www.yourkit.com/docs/10/help/startup_options.jsp)
Add the following startup options to the JVM start up .ini file located typically here:
/opt/yourbinarypath/runtime/.ini Open it with sudo command:sudo vi /opt/somepath/runtime/.ini Add the following next to the VM parameters like the Xmx etc.
Yourkit option: Using disablenatives to avoid running into an native sun library issue(Look at known issues 1.)
-agentpath:/etc/yourkit/yjp-2013-build-13050/bin/linux-x86-64/libyjpagent.so=disablenatives 5. Now, restart the JVM with the following command: sudo /etc/init.d/pxrt restart 6. First check if the JVM started successfully: ps -ef | grep java 7. Now check on JVM start up log if yourkit has successfully instrumented – tail /var/log/runtime.log. There should yourkit agent log like : yourkit listening on … 8. Start up Yourkit locally and use “Connect to remote application” and enter localhost:10001 (or whatever port you chose to forward to).

Profiling local java applications:
– Just run the yourkit UI. It should list the applications that are running locally. Find the right port listed to connect to the right local JVM(usually with name Main(eclipse)) running from eclipse. The local java applications should should automatically show up in the Yourkit UI on the first screen under Monitored Local Applications. When the local dev JVM is started it will automatically show up there.

Tunneling remote applications on Ec2 to the Yourkit library:
From the local host run the following command with the right port number that the profiler agent is listening on (not the JVM but yourkit agent. Typically default is 10001).
ssh -N -v -L: :10001 @j-worker-us-west-1b-01.zwei.mashspud.com
ssh -N -v -L: : usernameOnHost@
e.g.
ssh -N -v -L10001::10001 @remoteEc2Hostname A successful tunneling command should show the confirmed mapping of connection forward similar to:

debug1: Local connections to LOCALHOST:10001 forwarded to remote address :10001
debug1: Local forwarding listening on ::1 port 10001.
For more details take a look at :
http://kevingann.blogspot.com/2013/04/profiling-remote-ec2-tomcat-instance.html

Known Issues:
1. There is a known native library loading issue related to sun which breaks starting of the pxrt with yourkit library:
http://forums.yourkit.com/viewtopic.php?f=3&t=3644&start=0
Symptom: Errors in the log similar to : java.lang.UnsatisfiedLinkError: Error looking up function ‘$$YJP$$ Solution: is running with the disablenatives startup option in the pxrt.ini
2. Use the right bit version of the yourkit library(look for 32 bit vs 64 bit) mapping to the right JRE that the JVM is running with right version of library from the yourkit directory. http://kevingann.blogspot.com/2013/04/profiling-remote-ec2-tomcat-instance.html